Hippocampus RNA-seq atlas
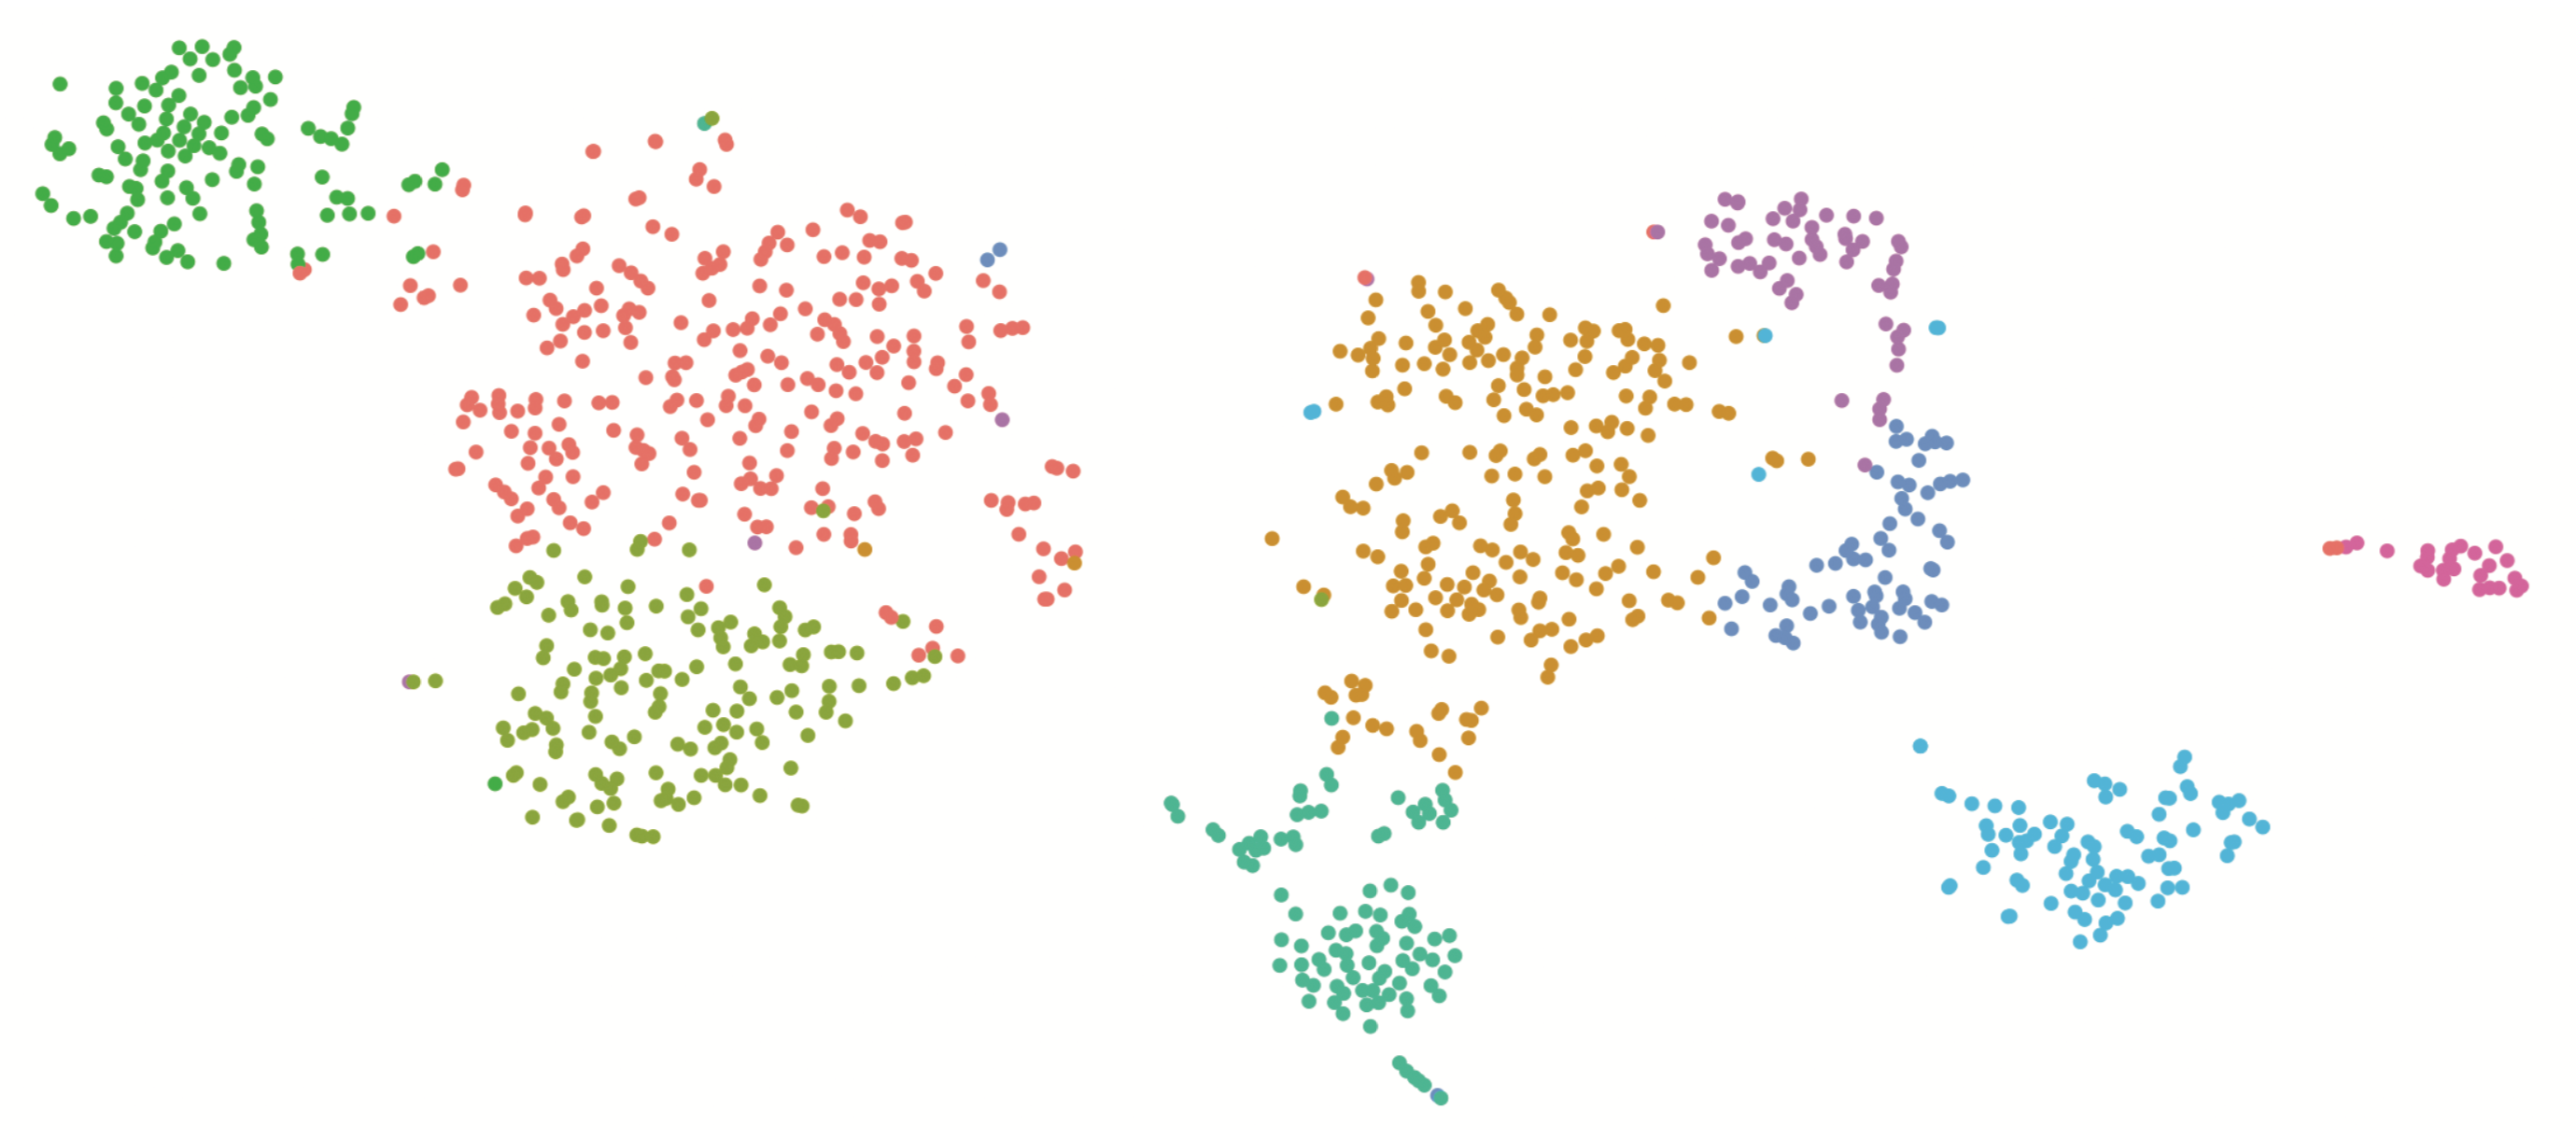
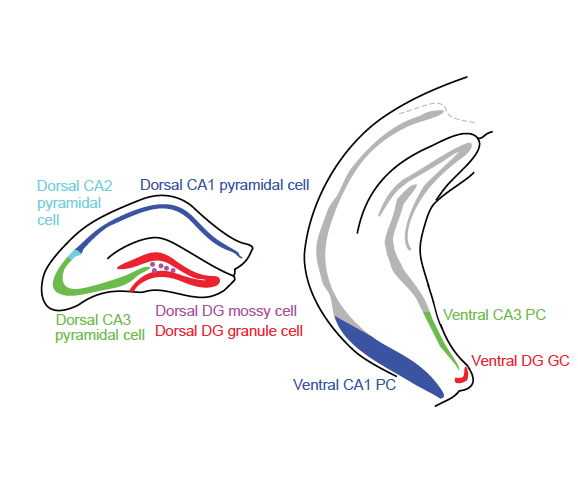
Here, you can interactively analyze and visualize RNA-seq data for all excitatory cell populations in the hippocampus at multiple levels of granularity. Analysis can be hypothesis driven by supplying predetermined lists of genes, or the dataset can be explored in a gene discovery-based fashion using enrichment and/or differential expression queries. To get started, select the population(s) of excitatory cells you are interested in analyzing, choose your desired level of analysis, and follow the prompts. Any figures or data generated during online analysis can easily be downloaded. Additionally, the full dataset of gene expression values can also be downloaded for offline analysis in other environments.
Choose Your Dataset
See the Brain RNA-seq website for additional single cell studies.


— OR —
-
Thanks for checking out HippoSeq. We have put together an example exploratory workflow to analyze differences in gene expression in CA3 pyramidal cells.
To end the tour hit the 'x' at the top of any popup or the [esc] key.
-
We'll look for these differences in the dorsal-ventral survey dataset.